

Momentum Strategies And Physics: Mass And Velocity Matter
Authored by Michael Lebowitz via RealInvestmentAdvice.com,
In his 1687 book, Philosophiae Naturalis Principia Mathematica, Sir Isaac Newton defined momentum as the product of mass and velocity, or p = m * v. The reason we begin with a physics lesson is that momentum strategies are very popular, and Isaac Newton’s famous formula can teach us a lot about financial asset momentum.
Recently, we have seen rapid shifts in and out of various sectors and stock factors that disrupt momentum strategies. Therefore, understanding how momentum strategies work can help you better identify when they might be effective and when it’s time to switch to a different approach.
The graphs used in this article are from 8/21/2025. Although slightly outdated, their goal is to help readers understand how to measure momentum rather than assess the current momentum state.
Physics 101
Returning to our basic physics formula, p = m * v.
To measure financial momentum, we also need to measure the velocity and mass of a financial asset or index.
Mass
Mass (m) in finance terminology refers to the trading volume or market interest behind an asset. Market cap or AUM, trading volumes, and investor sentiment can be used to measure mass.
The graph below, courtesy of SimpleVisor, highlights the bullish trend channel (blue) from late May through mid-August.
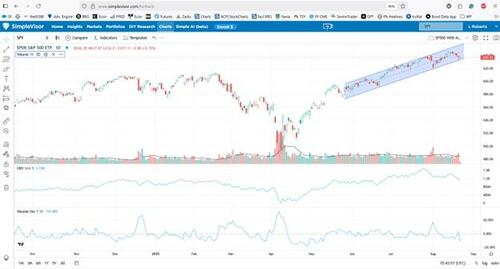
In this example, we will focus on three indicators to evaluate mass.
The first indicator is volume, along with its moving average. As indicated by the red and green bars, volume has remained steady throughout the trend. This is also supported by the relatively flat moving average (black line). Ideally, we want to see rising volume alongside a trend. However, volume isn’t decreasing either, which would suggest the trend is losing momentum.
The middle graph is On Balance Volume (OBV). OBV adds volume on days when a security’s price closes higher and subtracts volume when it closes lower. Therefore, it shows a running total of buying or selling pressure. Ideally, we want to see it increasing. Like we noted with volume, which is also flat, OBV momentum isn’t gaining strength, but it doesn’t indicate that momentum is declining either.
The bottom graph shows the Volume Oscillator, which compares a shorter and a longer moving average of volume. When it declines, it indicates that volume over the shorter moving average period is less than that of the more extended period. As shown above, the oscillator has been declining, though at a slow rate.
None of the volume indicators suggest a break in the momentum trend is imminent, but they also don’t indicate the trend is gaining strength.
Velocity
Velocity (v) quantifies the persistence of the trend and its slope.
Let’s revisit the graph above with three popular indicators of velocity.
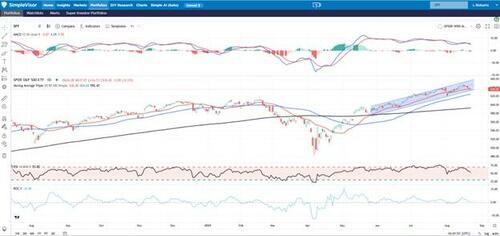
The graph shows the Moving Average Convergence Divergence, or MACD. The MACD is computed by subtracting a longer-term moving average from a shorter-term one. Additionally, a signal line, an even shorter moving average, accompanies the MACD. We examine not only the trend and level of the MACD but also convergences or divergences from the signal line. A convergence indicates a weakening trend, while divergence suggests increasing momentum. In the graph, the MACD remains stable with no apparent signs of convergence or divergence. Although generally bullish, the MACD level is high, which is difficult to sustain, and it has been gradually sloping downward.
The indicator just below the price chart is the Relative Price Index, or RSI. The RSI is an oscillator that measures the speed and magnitude of price movements. The index ranges from 100, which signals it’s very overbought, to 0, indicating it is very oversold. Typically, levels above 75 and below 25 suggest a reversal in momentum is likely. Equally important is the trend of the RSI line. Like most indicators, we prefer a gently rising or falling trend over sharp movements. Currently, after reaching overbought levels in late July, the RSI has generally been declining, showing that momentum is weakening.
Last is the Rate of Change (ROC). The ROC calculation shows the percentage difference between the current price and an earlier price. An ROC of zero, as indicated by the graph, means the price has not changed compared to 9 days ago. ROC should be above zero in an uptrend and below zero in a downtrend. However, during healthy market consolidations, the ROC can reach zero. In such cases, breaking below zero could coincide with breaking the highlighted price channel and a change in momentum.
What Is p?
Before moving on, let’s review the momentum of the S&P 500 based on the indicators and charts above. The highlighted trend channel, along with the mass and velocity indicators, suggests a market with positive momentum. Both sets of indicators are indicating some easing of momentum but not warning of an upcoming reversal. As we mentioned earlier, it’s healthy to experience brief periods of correction or consolidation in strong upward trends. So far, we should assume this is the case until our indicators and the price chart indicate otherwise.
Pitfalls of Momentum Strategies
Momentum strategies depend on the persistence of price trends and indicators that measure those trends, some of which are described above. When markets undergo significant two-way volatility or rapid rotations with market leadership shifting quickly between sectors and/or stock factors, momentum strategies often face difficulties.
The biggest problem with the strategy is its delayed reaction. Because momentum strategies rely on past price data, trends may reverse or fade before the strategy can fully take advantage of them, resulting in whipsaw losses. Additionally, the model might not detect a new momentum trend until it is well into the cycle, leaving little upside potential.
Another important factor is time. If you plan to follow a momentum strategy, you must decide whether you’re a short-term trader or a medium- or long-term investor. A short-term trader might use minute-by-minute data to capitalize on momentum trends over hours or days. Long-term traders, on the other hand, need to focus on the bigger picture. Naturally, the scope of that picture depends on how long-term an investor you are.
Mitigating Data Lag
When markets are volatile and rotations occur quickly, momentum can still be effective. Still, strategies need to adjust to the environment. For example, you may want to use shorter lookback periods to capture momentum changes more quickly.
Another practical step is diversification. Instead of depending on just one or two sectors, factors, or stocks with strong momentum, think about broadening your portfolio. This can help reduce the volatility of your returns. Additionally, including other value factors, such as market capitalization, beta, or value versus growth, alongside the momentum indicator, can result in more stable outcomes.
Summary
Momentum strategies give investors the chance for higher returns than the market. Additionally, momentum can be fairly easily measured, allowing investors to use a rule-based system, which can help reduce the influence of emotions on trading decisions.
Momentum strategies, like all other investment strategies, have periods when they perform well and periods when they underperform. For example, during periods of quick rotations where momentum trends are not sustained and volatility is high, investors can often find themselves on the wrong side of momentum.
We leave you with the graph below.
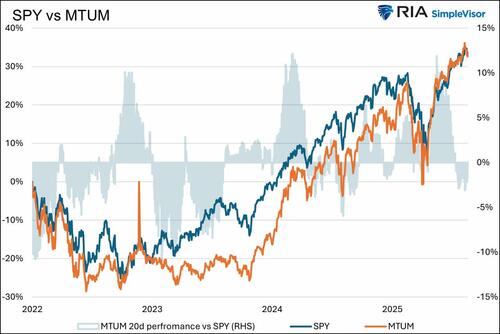
Since 2022, the performance of a widely followed momentum ETF (MTUM) has matched the S&P 500 (SPY). However, the blue shading indicates that although both ended up in the same place, the strategy experienced periods of outperformance and equally poor periods of underperformance.
Tyler Durden
Wed, 08/27/2025 – 14:25